Features
Everything a commerce BI team needs, defined once.
Zeroth is a complete BI product, not a charting layer: semantic layer, dashboards, engines for comparisons, forecasts and drivers, a governed AI analyst and the operations around them.
Semantic layer
One definition per number, in git.
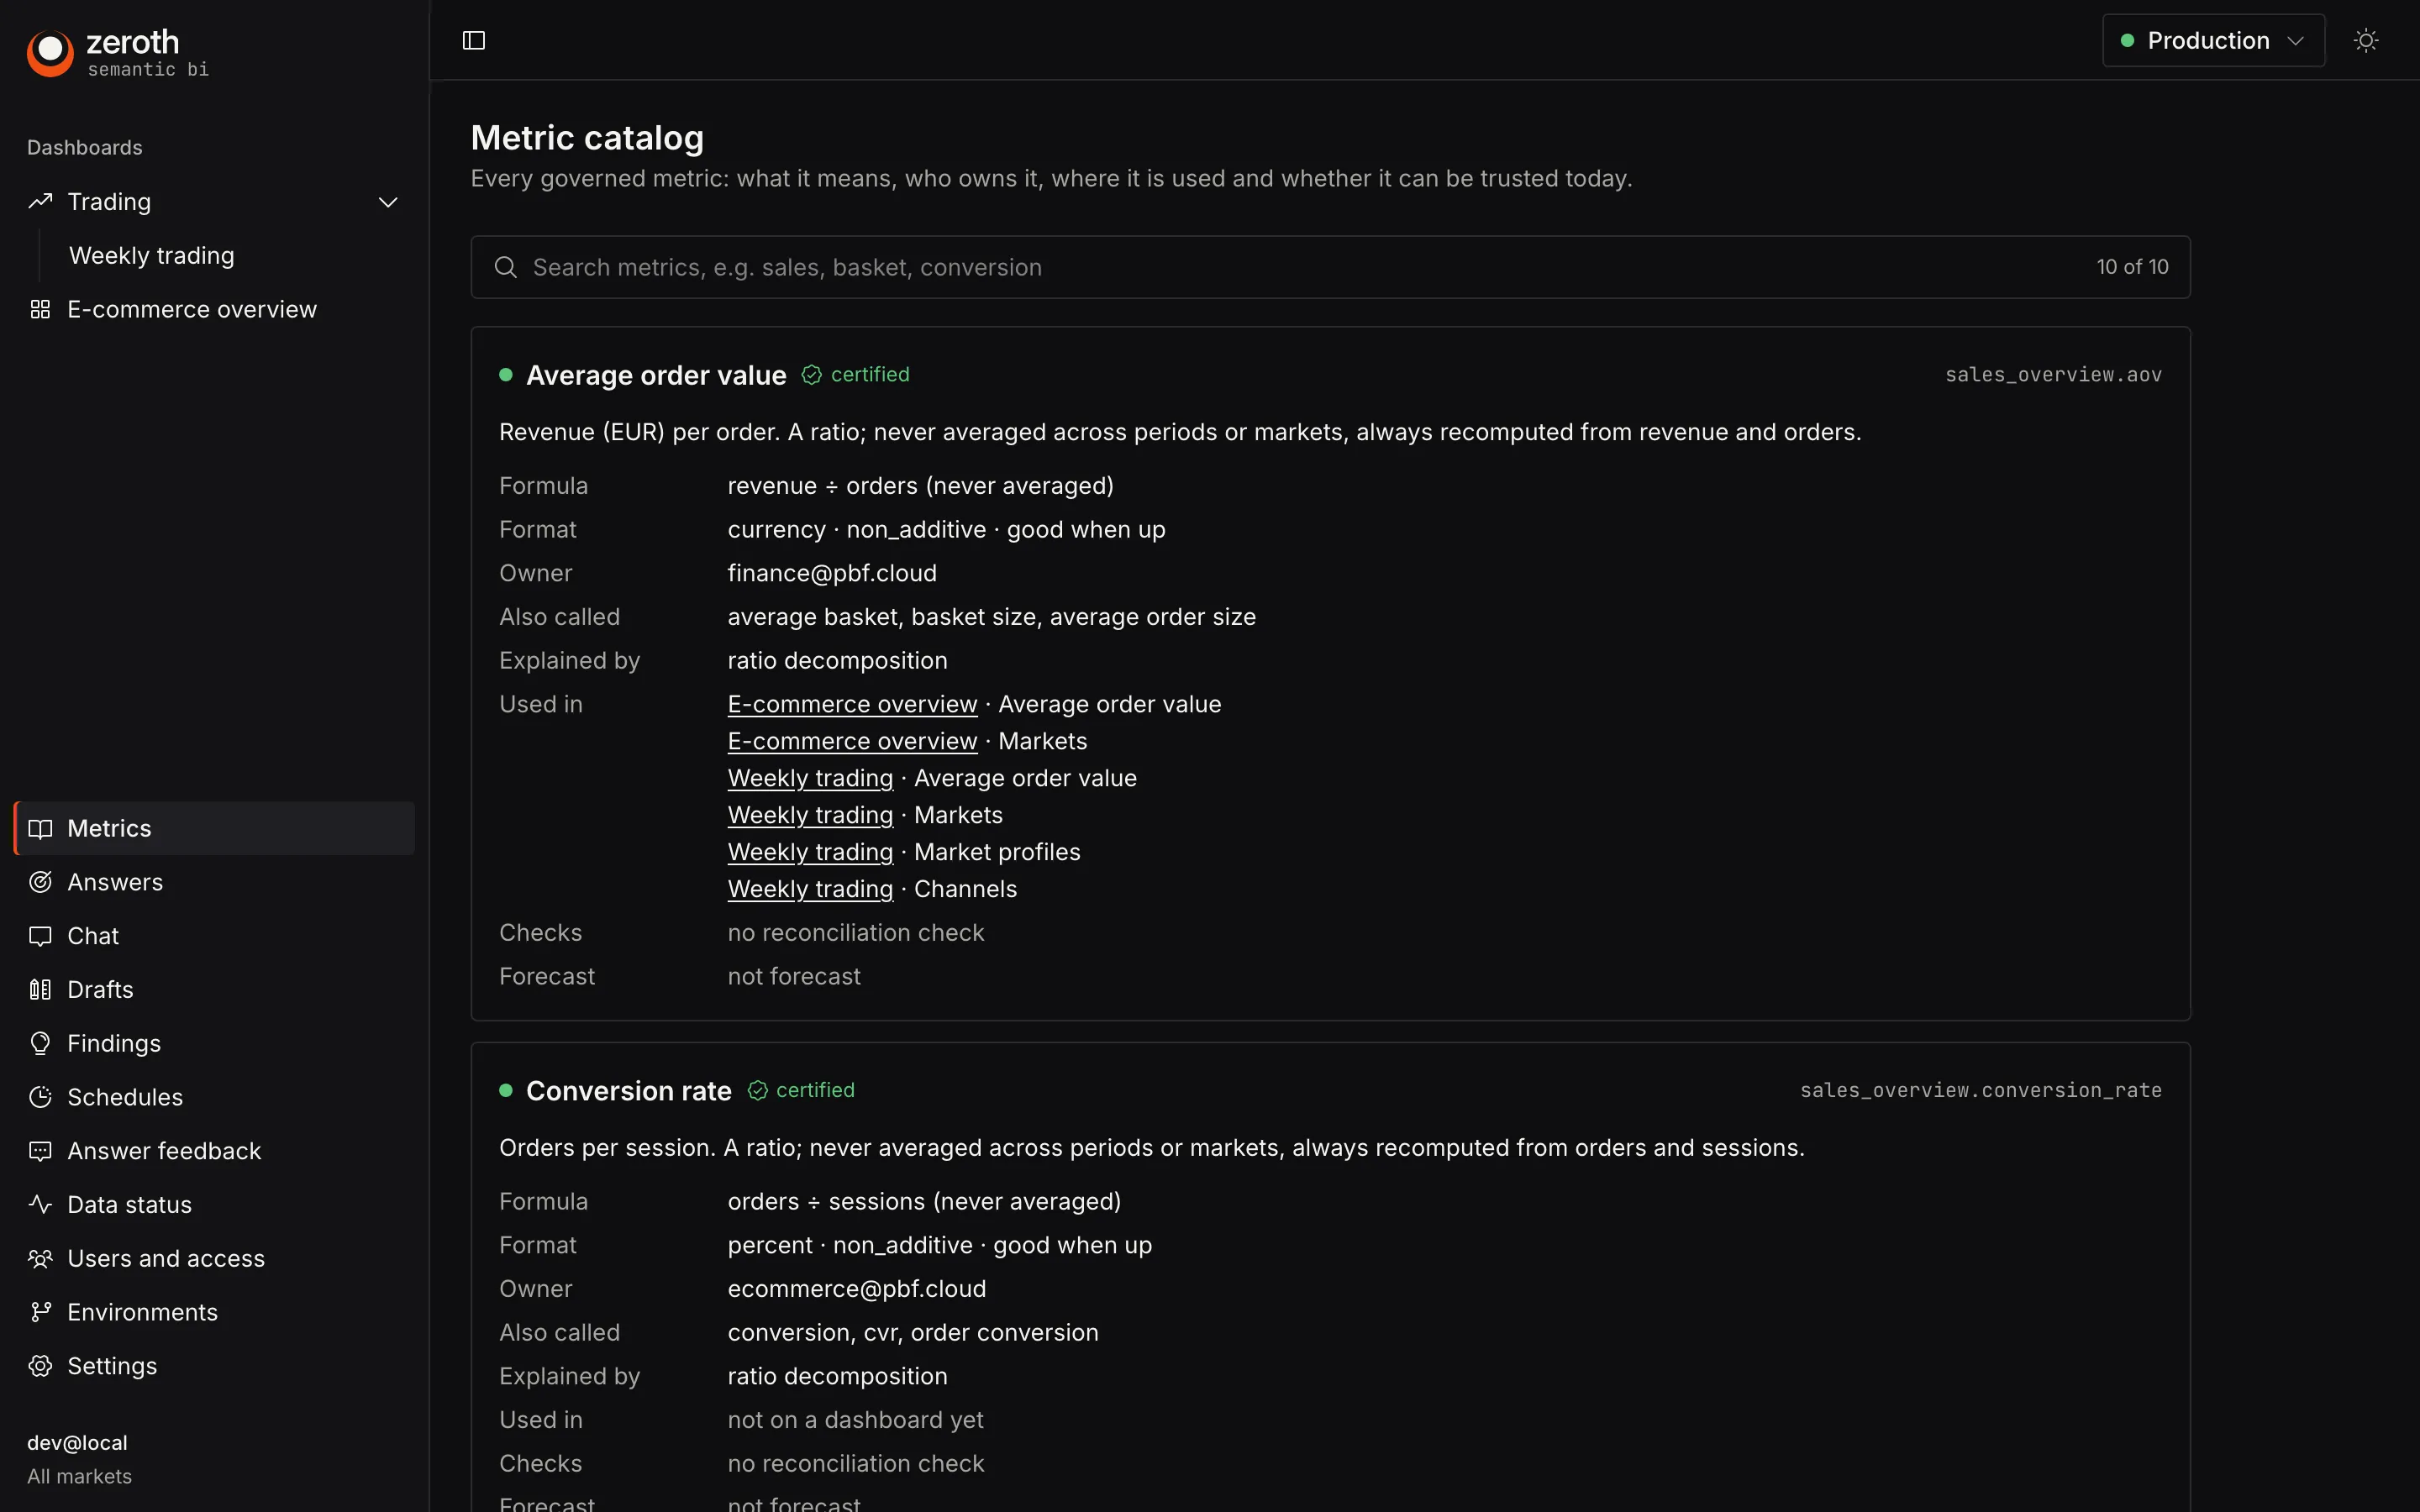
Measures and dimensions are defined once in a Cube semantic layer on DuckDB, in your repository. Dashboards, chat, digests and analyses all query it, so the same metric can't drift between places.
- A metric catalog with owners, certification, caveats, usage, health and forecast accuracy
- Ratios recomputed from their components, never averaged
- Currency converted in the semantic layer, with constant currency as a comparison option
- Daily BigQuery extracts with explicit column allowlists; no PII columns
Dashboards as code
Dashboards are YAML files, reviewed and published by pull request.
A validated schema covers every tile, with errors your CI and your reviewers can read. What gets merged is what people see.
- KPIs, targets, line, area, bar, combined, funnel, sankey, pie, radar, gauge, maps, tables, text and summaries
- Typed filters at page, dashboard and tile level; a date picker that knows your calendars; a comparison picker
- Tabs, sections, reusable blocks, rich tooltips and state layers
- Event annotations on charts; light and dark themes and client palettes; CSV, PNG and print exports that carry the time range and rule
Drafts
Analysts draft in the app; git stays the source of truth.
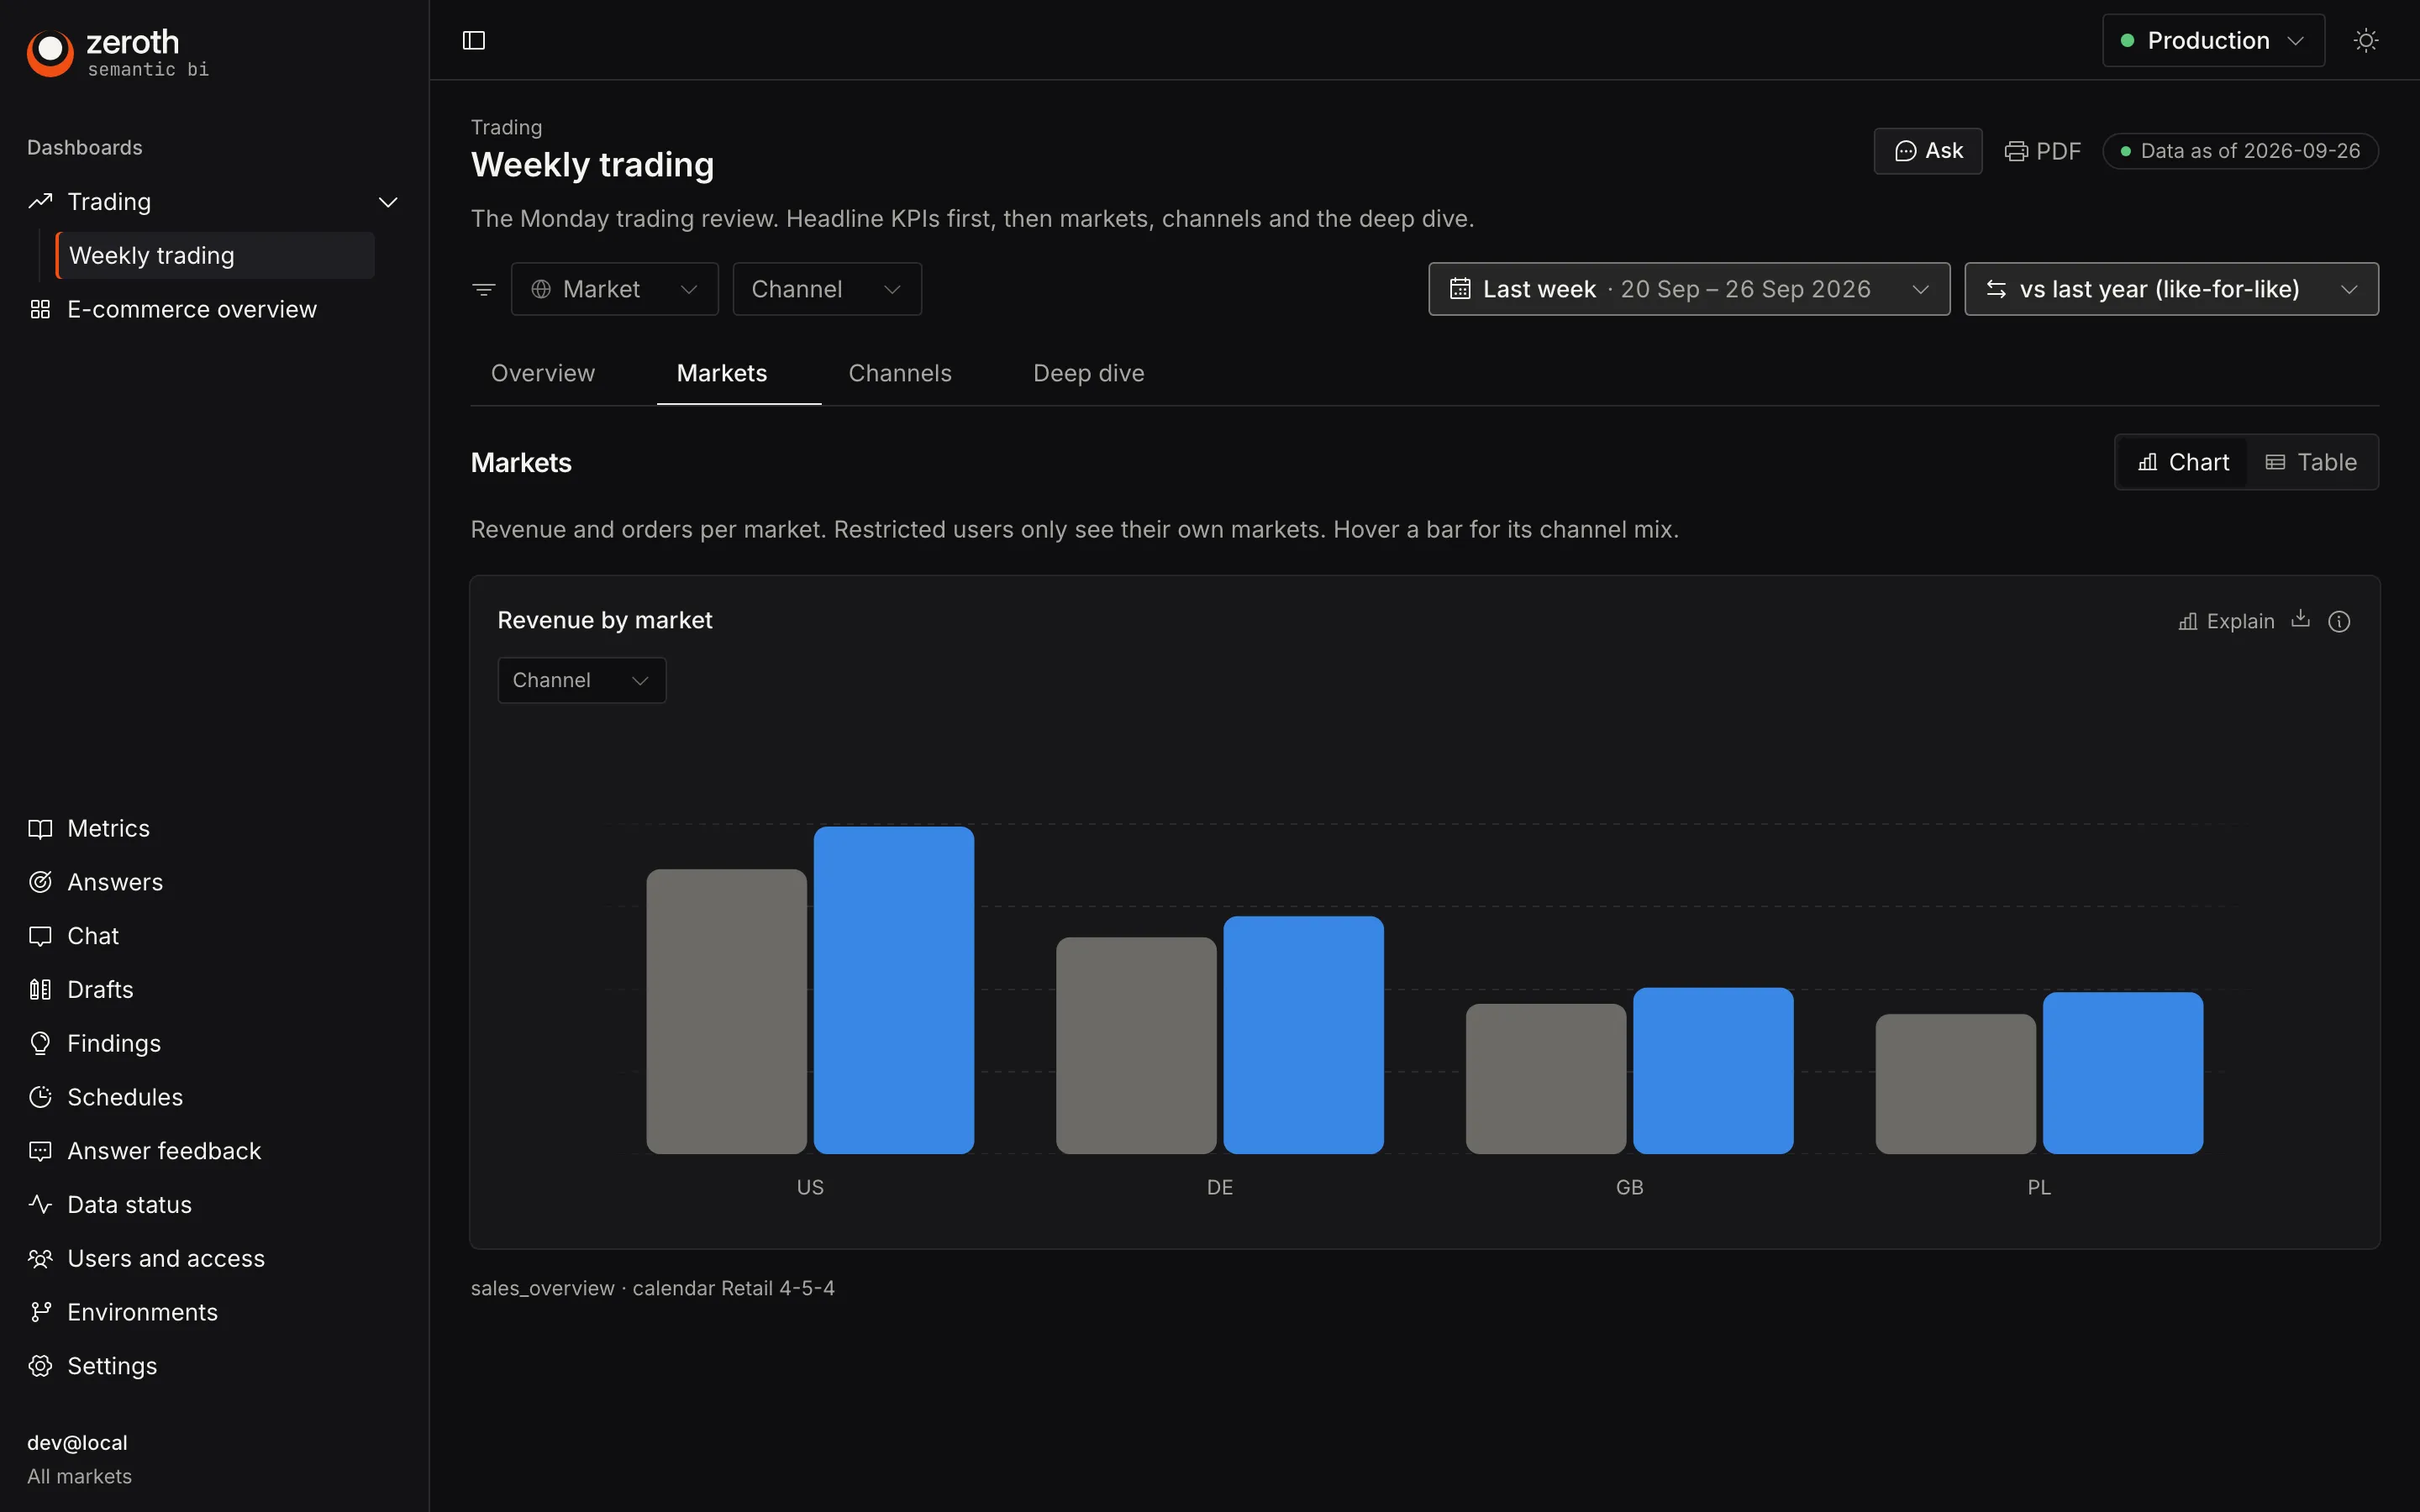
In staging, analysts build drafts with an authoring assistant that only edits the draft it was opened on, using governed metrics. Publishing opens a pull request.
- Element guide with previews, and an assistant that suggests the right chart
- Drafts are private or shared, always labelled uncertified
- Proposals go to your config repository as pull requests
Time and comparisons
Comparisons that compare the right days.
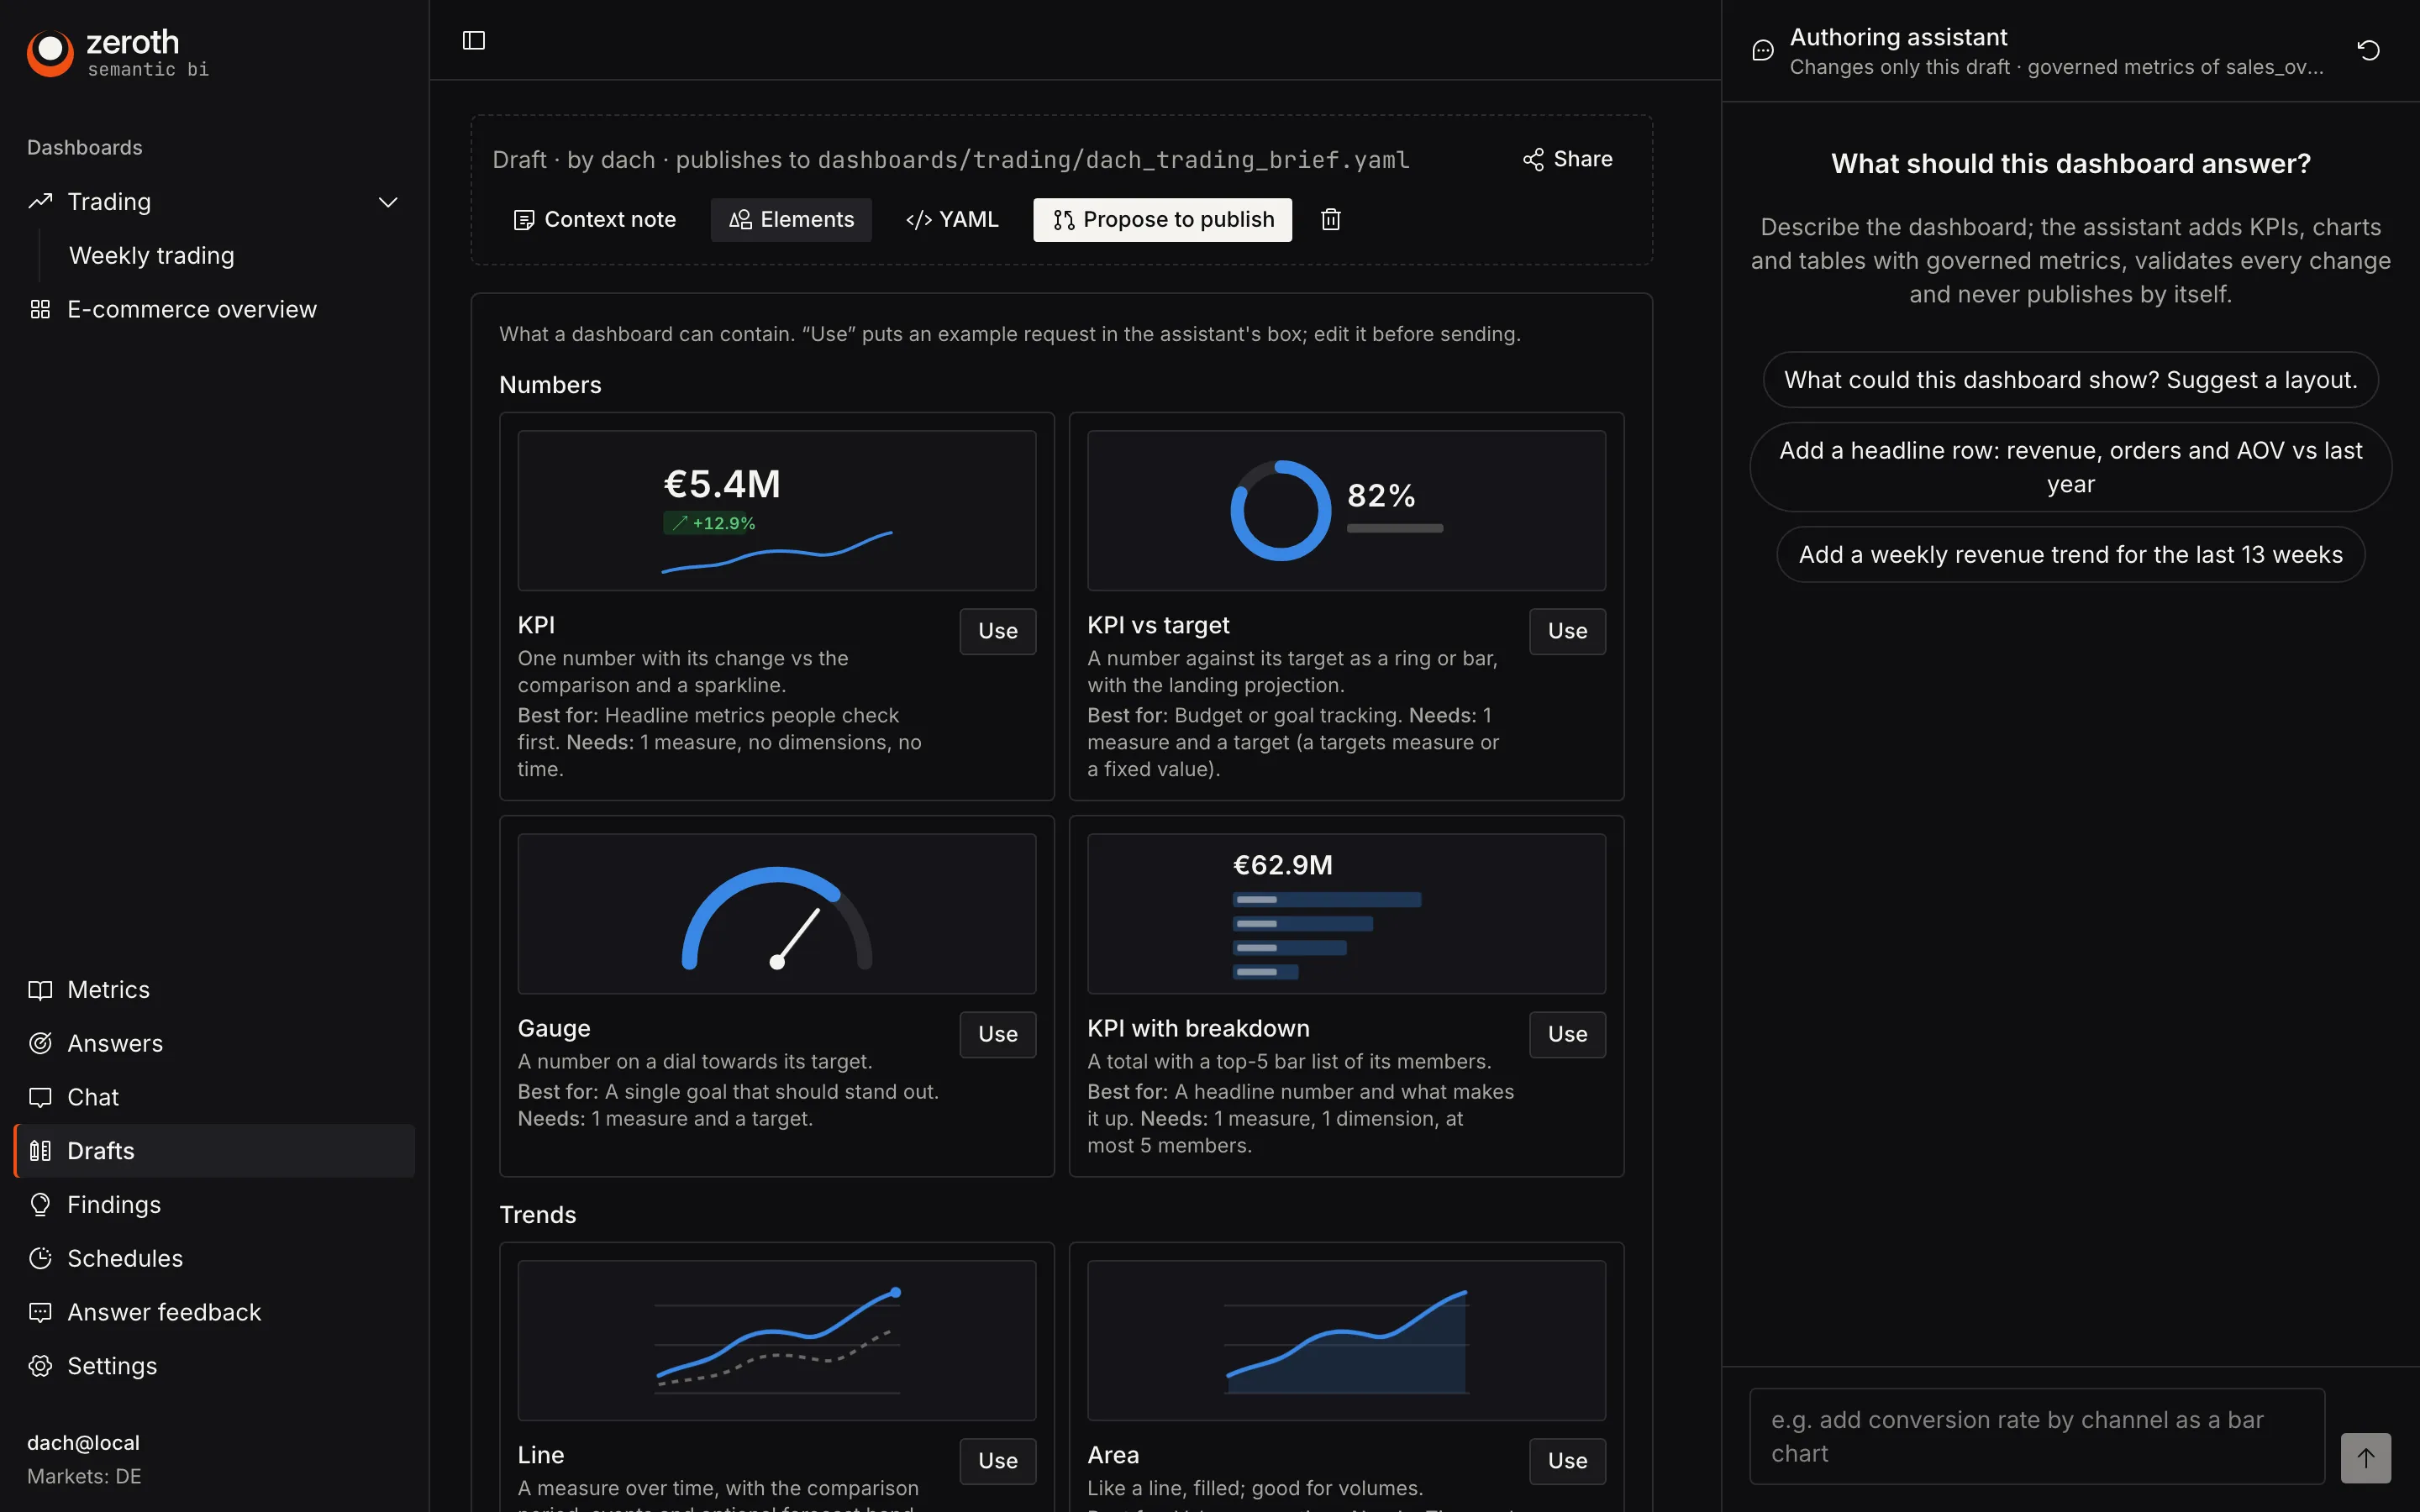
Trade calendars and comparison rules are configuration, generated at build time and resolved through one engine. Every result says exactly which windows it compared and why.
- Like-for-like, same period last year, previous period, vs target and vs forecast built in
- Retail 4-4-5, 4-5-4 and 5-4-4 calendars with an explicit week-53 policy; fiscal and ISO calendars
- Event-anchored comparisons (Easter, Black Friday) with fallbacks; custom offsets and mappings
- Business dates local per market; incomplete periods compared to date and always marked
# comparisons.yaml (lfl_ly, same_period_ly and others are built in)
comparisons:
  - id: easter_aligned_ly
    type: event_anchored
    anchor: { event_type: holiday, title_match: "^Easter Sunday$" }
    window: { before_days: 14, after_days: 7 }
    fallback: lfl_ly
  - id: lfl_ly_constant_currency
    type: day_mapped
    base: lfl_ly
    currency: constant

# calendars.yaml
calendars:
  - id: retail_454
    type: retail
    pattern: "4-5-4"
    week_53_policy: restate   # chosen explicitly, never guessed
Explain
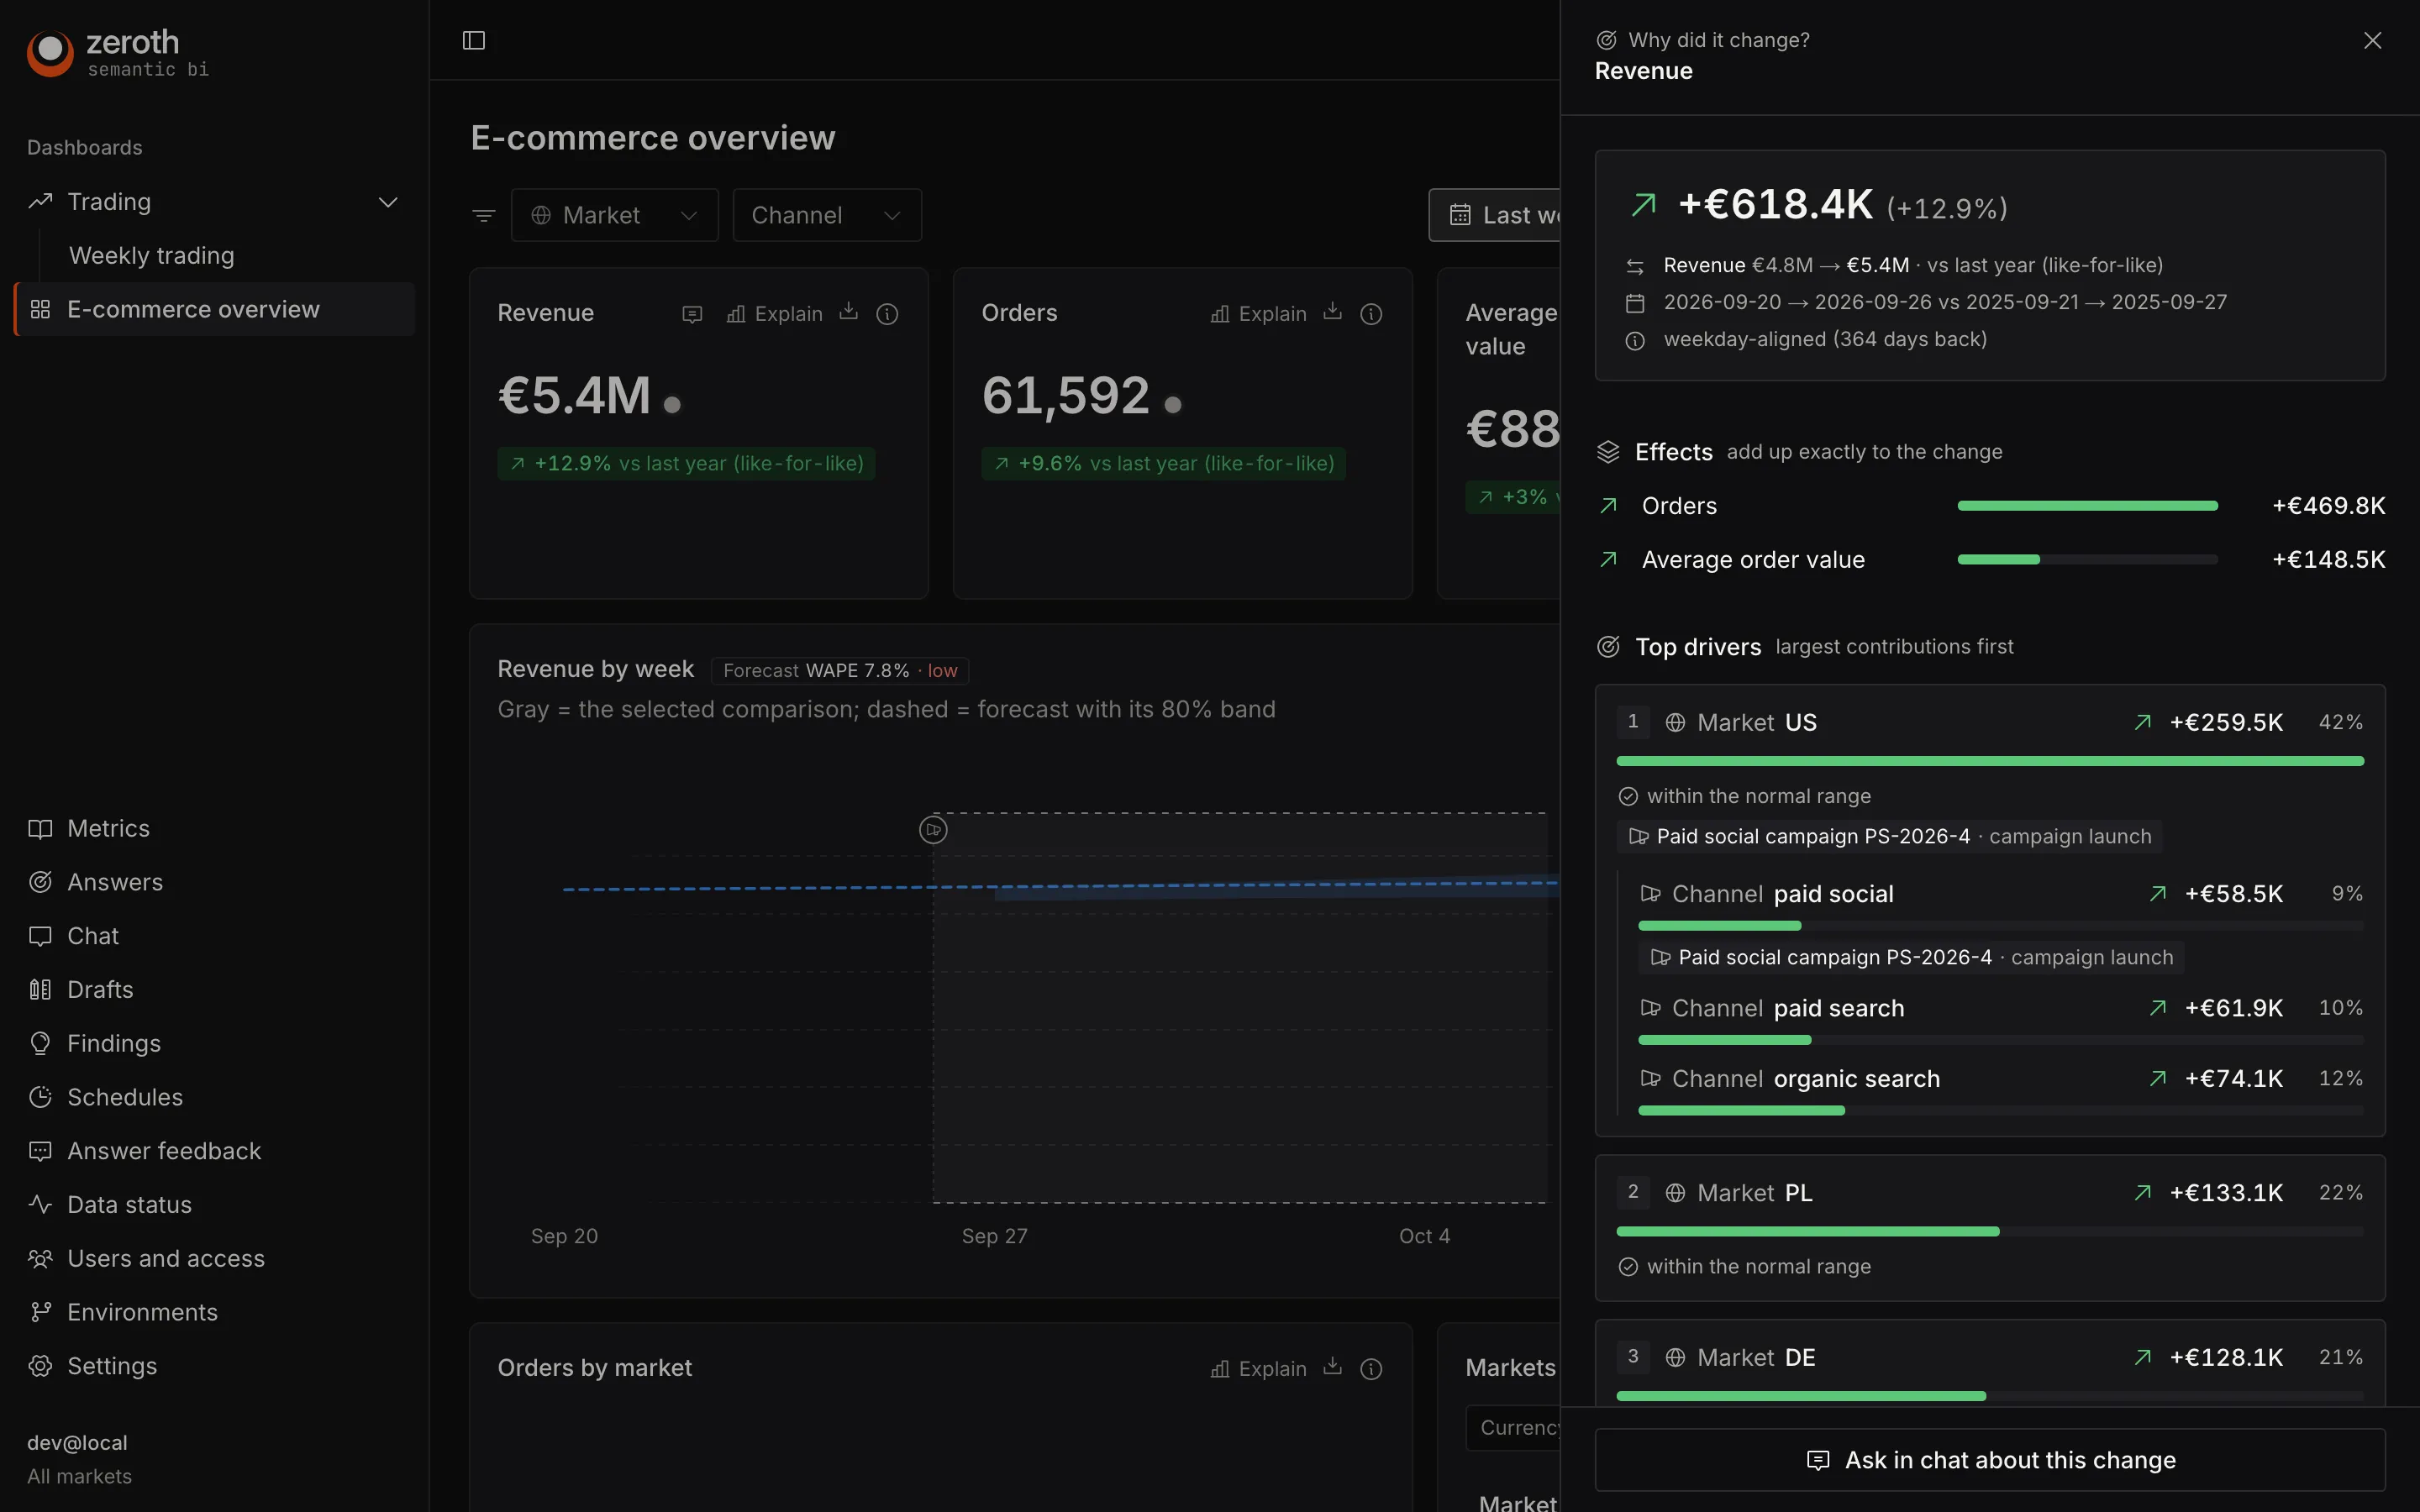
Why did it change? Effects that add up exactly.
Explain runs on the comparison's own windows: it splits a change into factors (orders × average order value, rate vs mix), then searches dimensions for the drivers and flags what's outside the normal range.
- Contribution, dimension search, shift-share and LMDI decompositions
- Drivers checked against forecasts and matching events
- Events are possible explanations, never presented as causes
- One click to continue the question in the chat
Chat
An analyst that can't make numbers up.
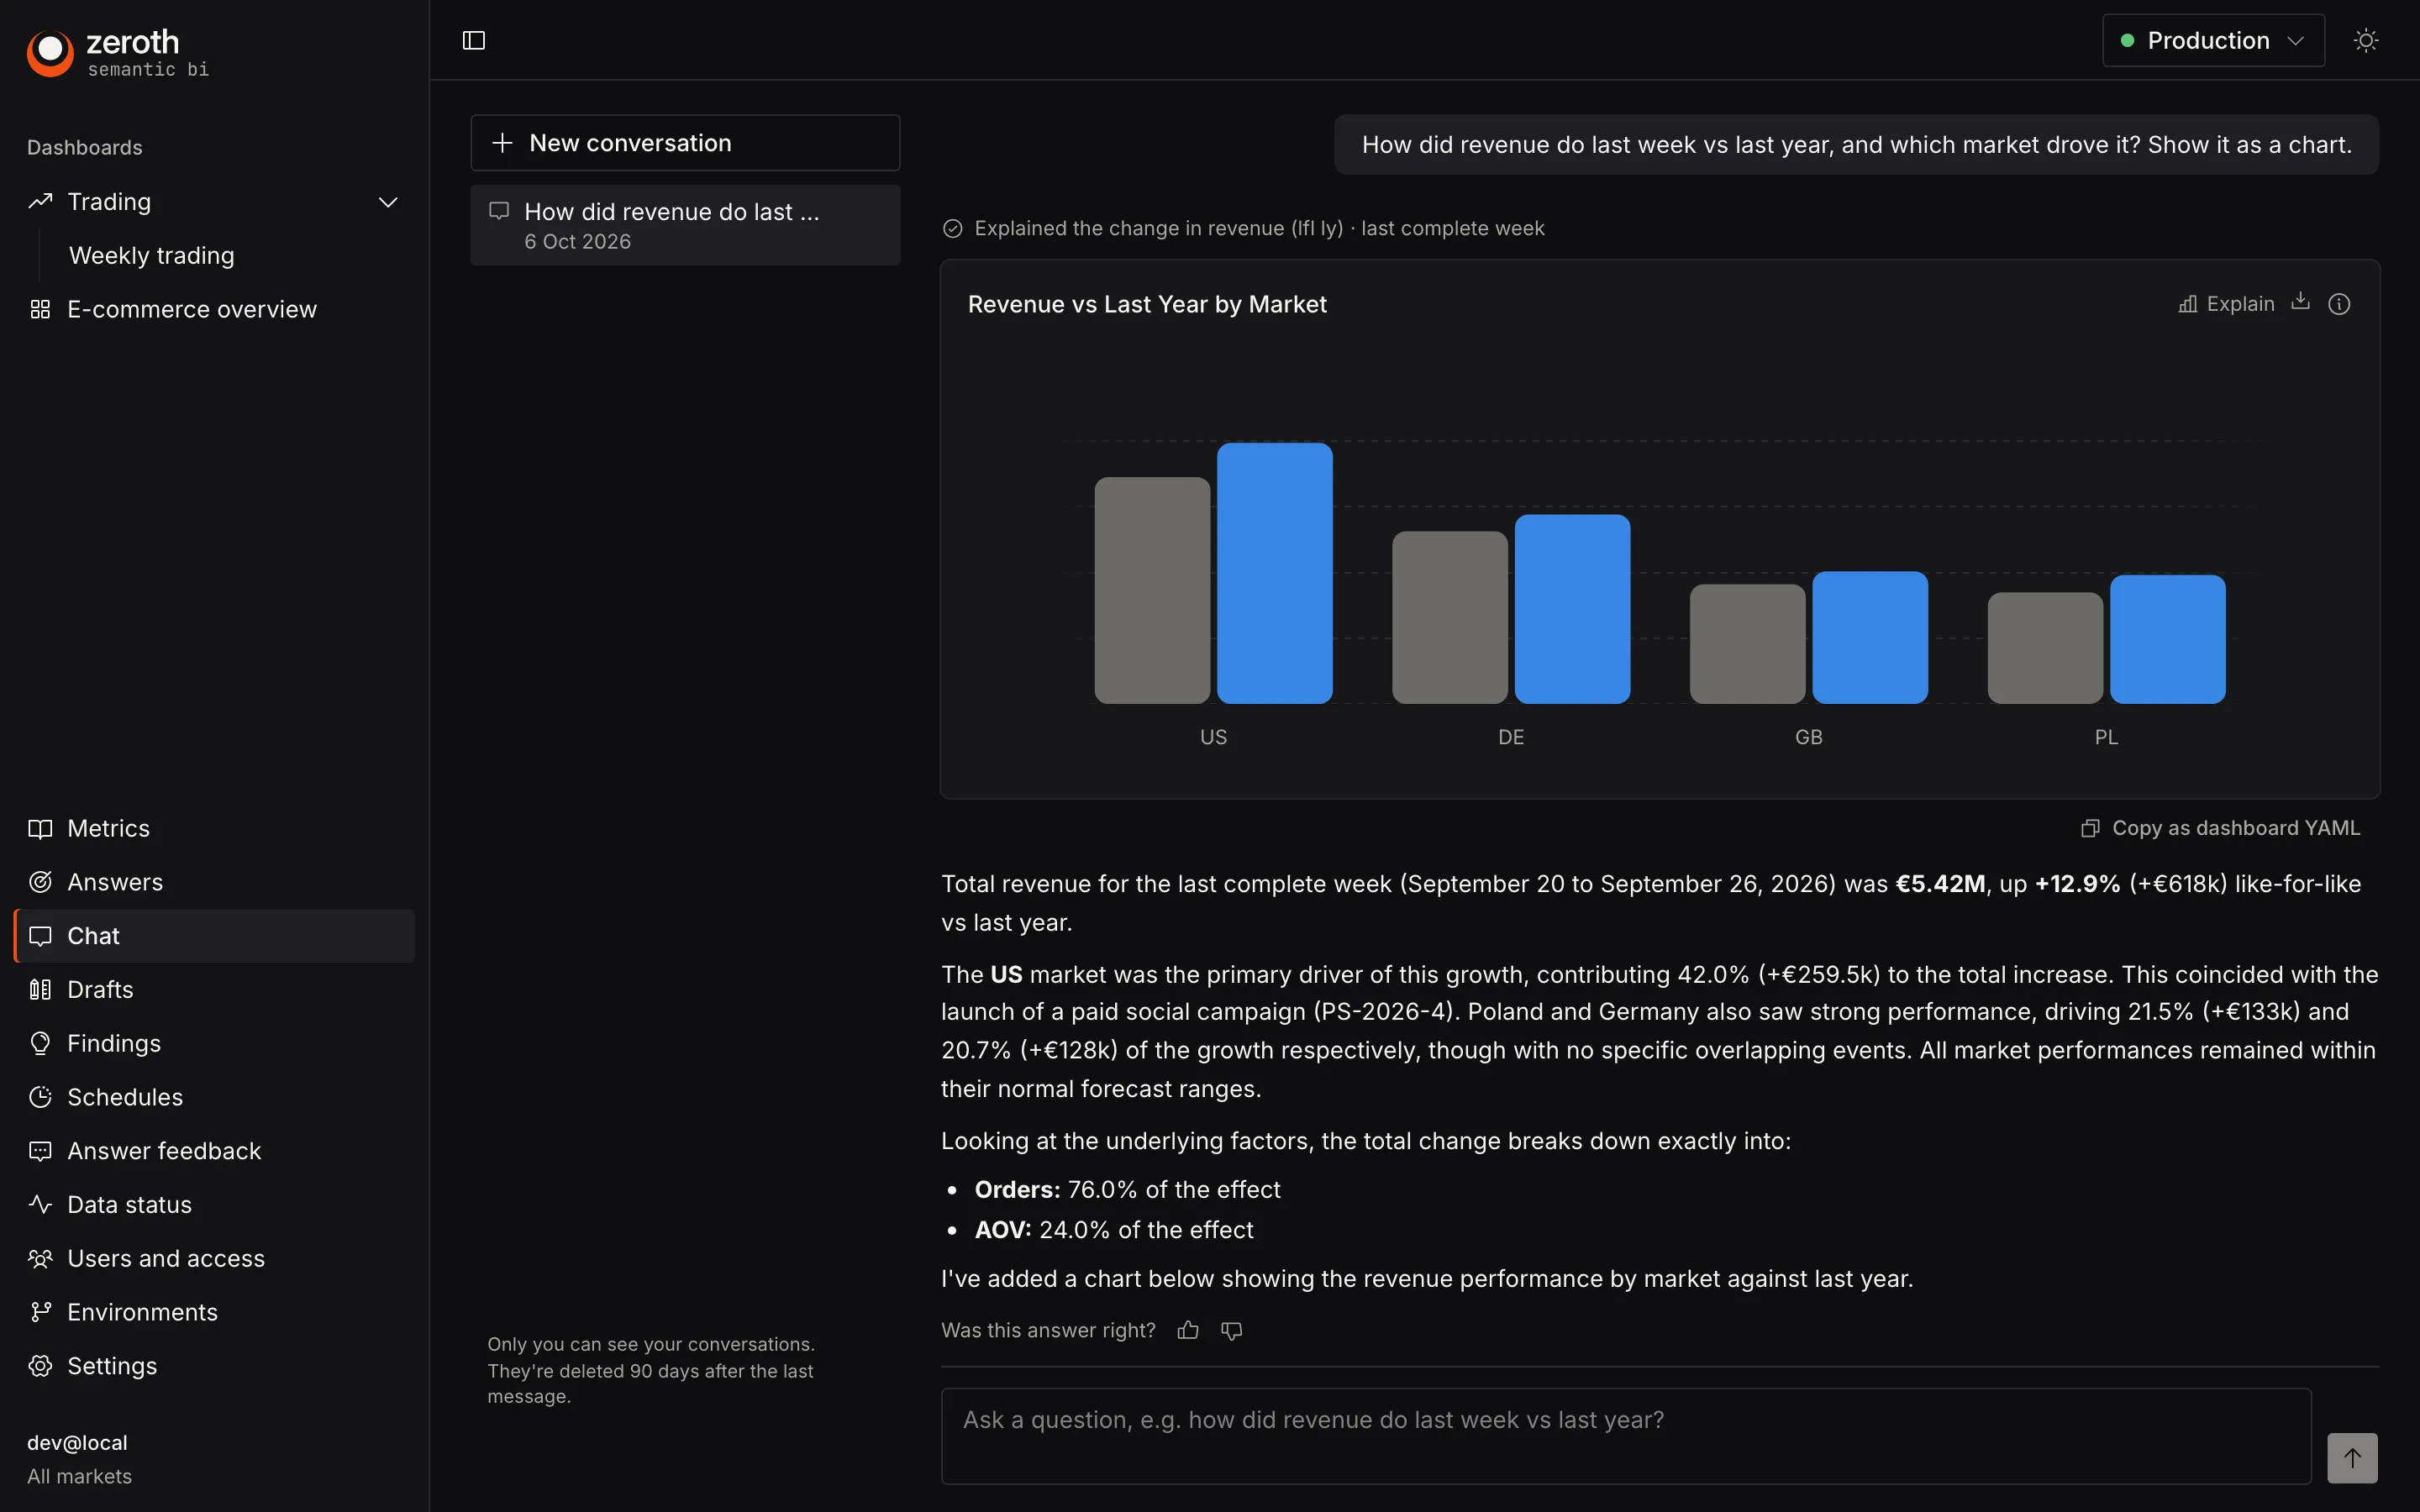
The chat is read-only. It has eleven tools, all over the semantic layer and the engines, never raw SQL. Answers carry their metric, time range and comparison, with inline charts you can copy into a dashboard.
- Works with the model you choose; Gemini on Vertex AI recommended, without API keys
- Saved conversations, business context per department, feedback on answers
- Asked from a dashboard or a tile, it starts from what's on screen
- Every number in summaries and findings is checked against the data before it's shown
Forecasts and targets
Forecasts that have to earn their place.
Forecasts are batch artefacts in each data version, chosen per series in a backtested tournament. A model is kept only if it beats a seasonal-naive baseline; otherwise Zeroth falls back and says so.
- Statistical and machine-learning models, reconciled across hierarchies, with conformal intervals
- Anomalies against forecasts issued before the fact, never after
- Targets from sheets or BigQuery, phased so they sum exactly to the source
- Period projections: where you'll land vs target
Summaries and digests
The numbers come to people.
Summary blocks write a headline paragraph over the tiles on a page. Scheduled analyses run after each pipeline or on a timetable, and digests go out by email or Slack, all with the reader's own access.
- Organisation-wide analyses in git; people schedule their own in the app
- Findings whose numbers aren't backed by the data stay out of chats and digests
- Recipients limited to your domains
Data trust
No data version reaches users unless the checks pass.
Each daily pipeline builds a candidate, runs your reconciliation checks against it and only then switches traffic. Blocking failures hold the version back and alert; warnings publish with an amber health badge.
- Per-market completeness; the current day is always marked incomplete
- Stale-data banners and health on every tile
- Alerts for job failures, staleness, held-back versions and chat cost
Access
Everyone sees exactly their rows.
Roles combine a capability (reader, analyst, developer, admin), a data scope and folder access. Row-level security covers every cube, including events, forecasts and health details.
- Google sign-in through Identity-Aware Proxy; users and Google Groups assigned to roles in the app
- Market and any other scope dimension
- Staging and production environments from branches, with a preview for every pull request
Install
In your Google Cloud, in about a day.
One Terraform module installs the services in your project. Starter packs bring a model, dashboards, comparisons, forecasts and reconciliation checks for common sources.
- Starter packs: GA4 e-commerce, Shopify commerce, paid media
- The zeroth CLI adds and upgrades packs without overwriting your edits
- Serverless: idle cost is about one warm Cloud Run instance
See your own numbers in Zeroth.
A walkthrough on a realistic multi-market dataset, then we talk about your stack and what an install would look like.