Skip to content

zeroth. semantic bi

Every number,measured fromthe same zero.

One set of metric definitions, the same trade calendar, one currency rule, one completeness cut-off per market. Dashboards, chat, digests and analyses all start from that origin, inside your own Google Cloud project.
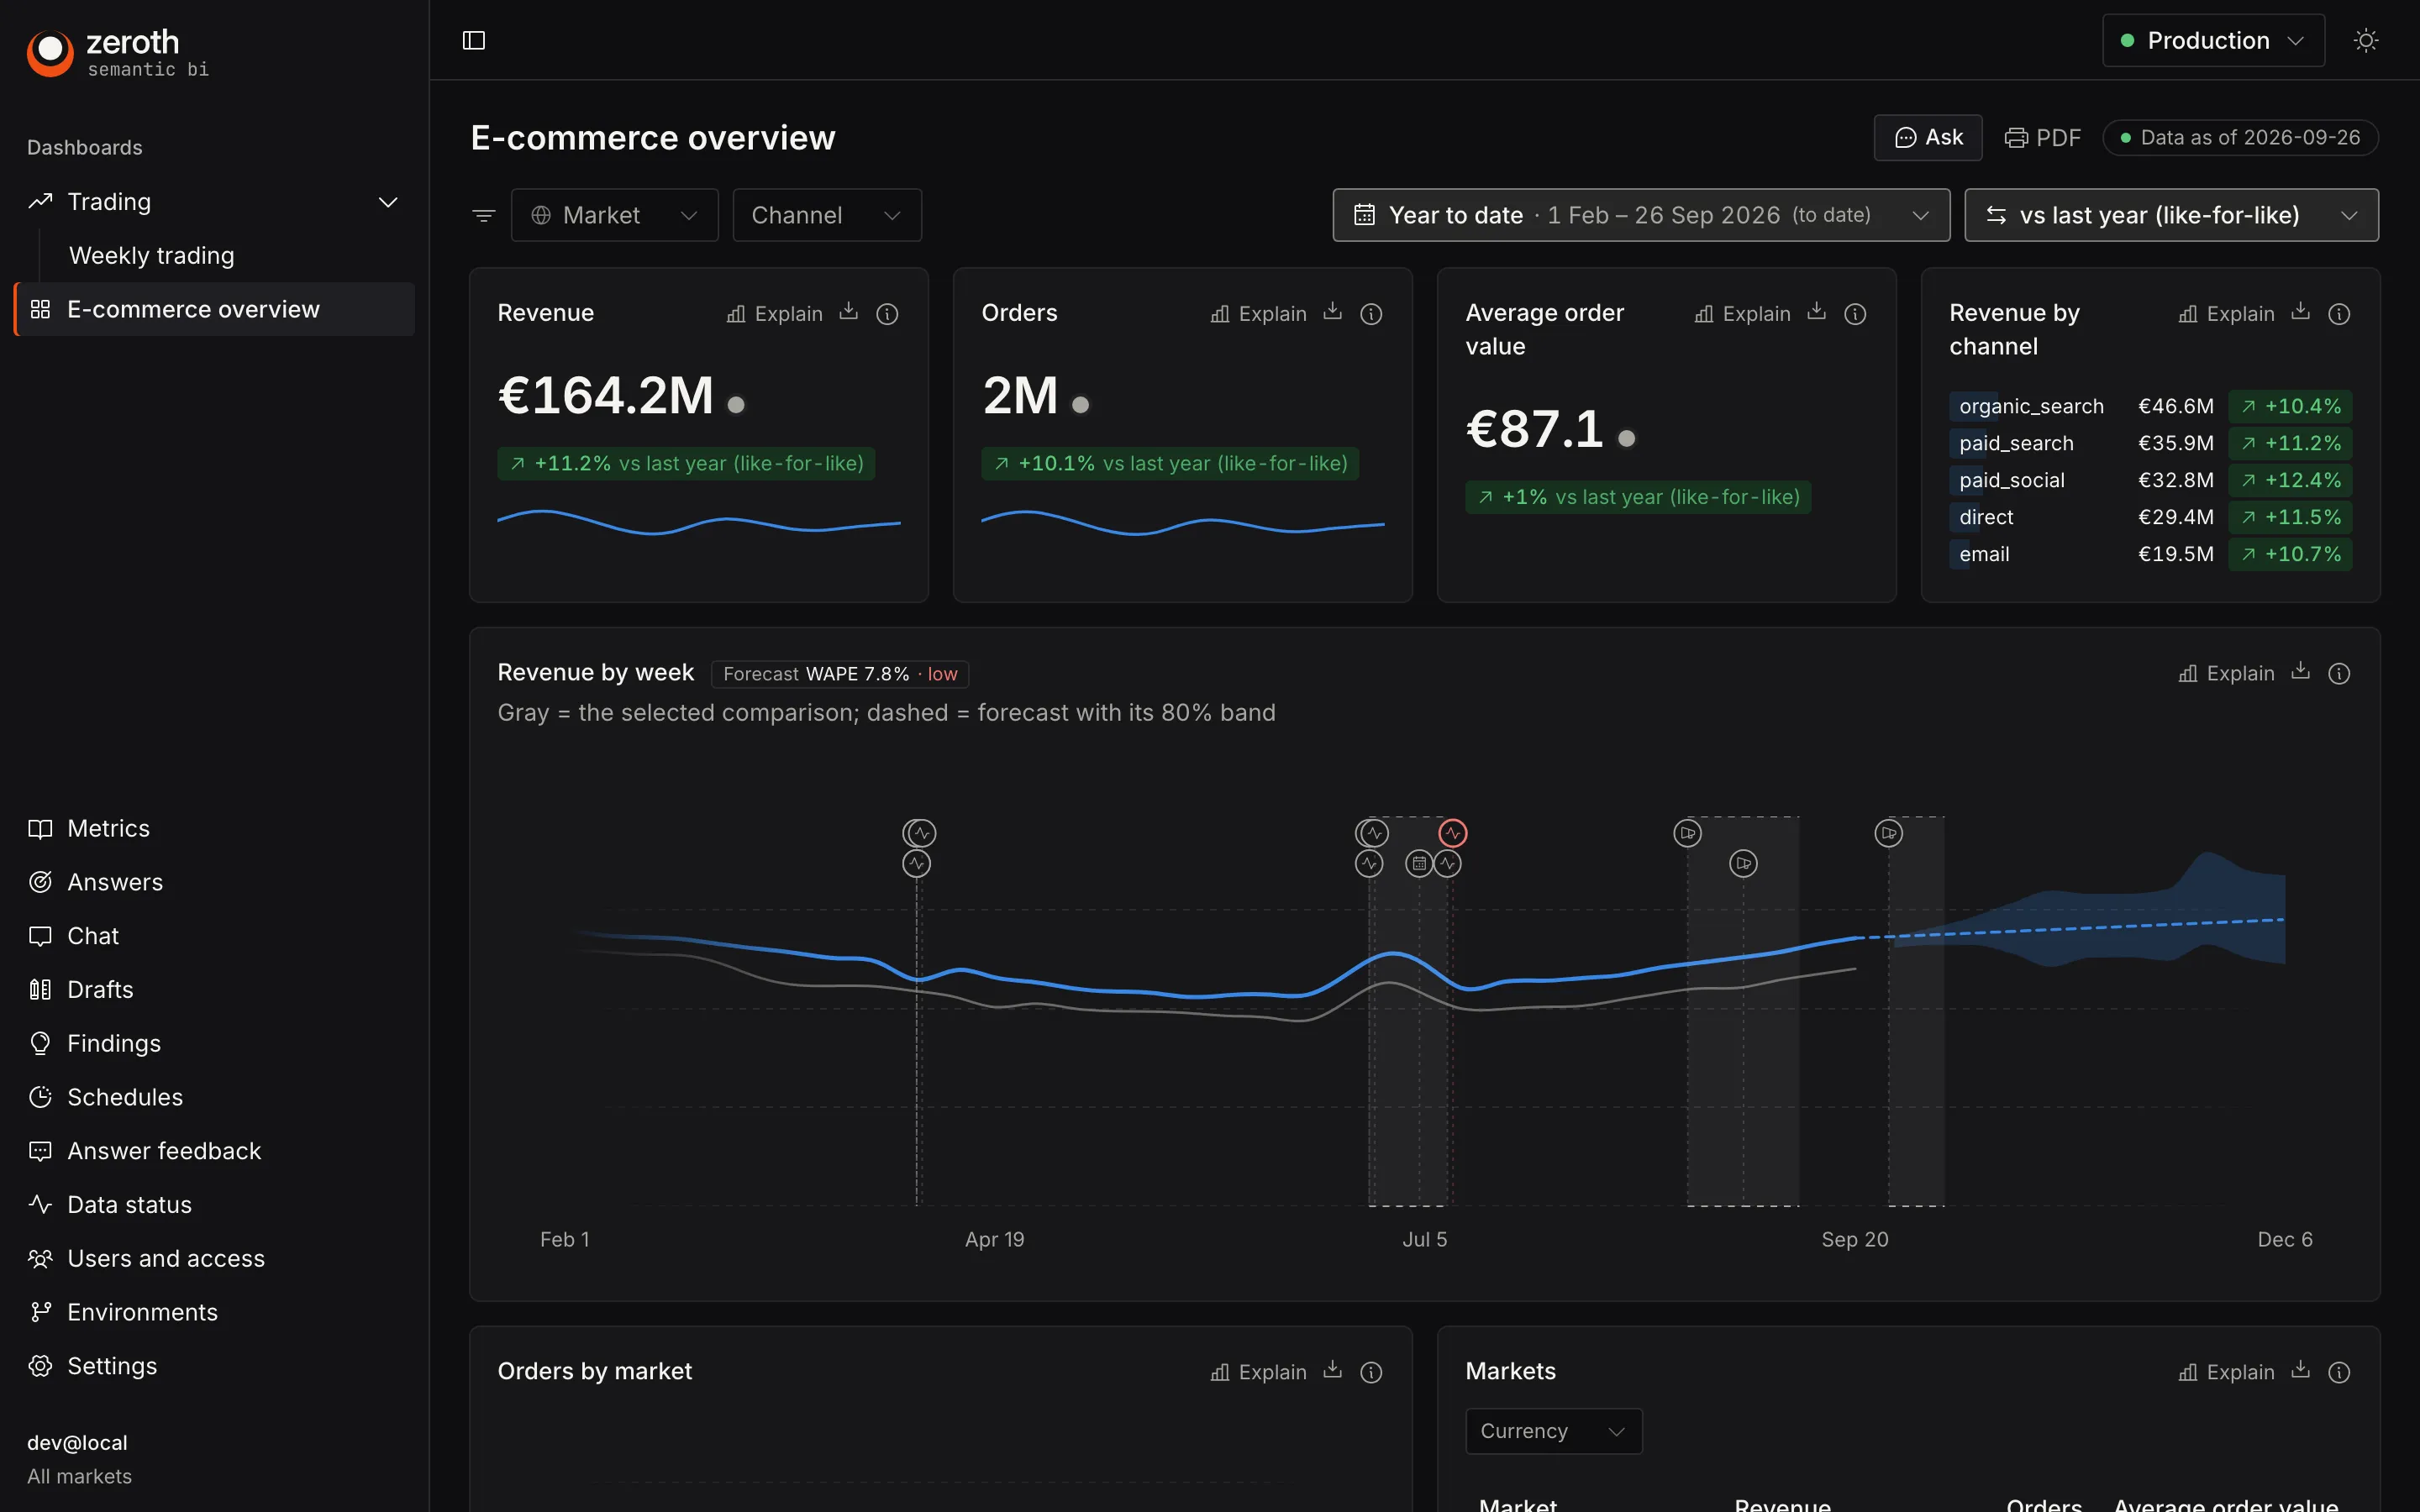
Zeroth BI
The E-commerce overview dashboard in Zeroth: KPI cards with like-for-like deltas, revenue by channel, and revenue by week with a forecast band and event markers.
E-commerce overview dashboard · synthetic multi-market sample data

Why Zeroth

Most BI problems are definition problems.

Charts are the easy part. Trust breaks earlier: in how a metric is defined, which days are compared and who is allowed to make up an answer.

The same metric, five definitions

Revenue in the board pack, the trading dashboard and the spreadsheet disagree, and nobody can say which one is right.

Comparisons that compare the wrong days

Last year by calendar date instead of like-for-like, week 53 ignored, currencies converted in three different places.

AI that guesses

A chatbot writing SQL against raw tables gives fluent answers no one can check, with numbers that aren't anywhere else.

How it works

The definitions come first. Everything else is counted from them.

  1. 01

    Define once

    Metrics, comparisons and trade calendars live in a semantic layer in your git repository, reviewed like code.

  2. 02

    Build in git

    Dashboards are YAML files, validated in CI and published through a pull request. Analysts can draft them in the app with an assistant.

  3. 03

    Ask and explain

    The chat, Explain, summaries, scheduled analyses and digests all use the same definitions, with every number traceable.

dashboards/trading/weekly_trading.yaml
id: weekly_trading
title: Weekly trading
view: sales_overview
comparison: { default: lfl_ly }
tiles:
  - id: revenue
    viz: { type: kpi }
    query: { measures: [sales.revenue] }
    compare: lfl_ly   # like-for-like vs last year
CLIzeroth
$ zeroth pack add shopify-commerce
✓ model, dashboards and checks installed
$ zeroth pack check
✓ contract ↔ extract ↔ model consistent
$ git push origin metrics/net-revenue
# CI validates every dashboard against the model;
# a reviewer merges and the change is live.

Explain and ask

It explains changes, and you can check every answer.

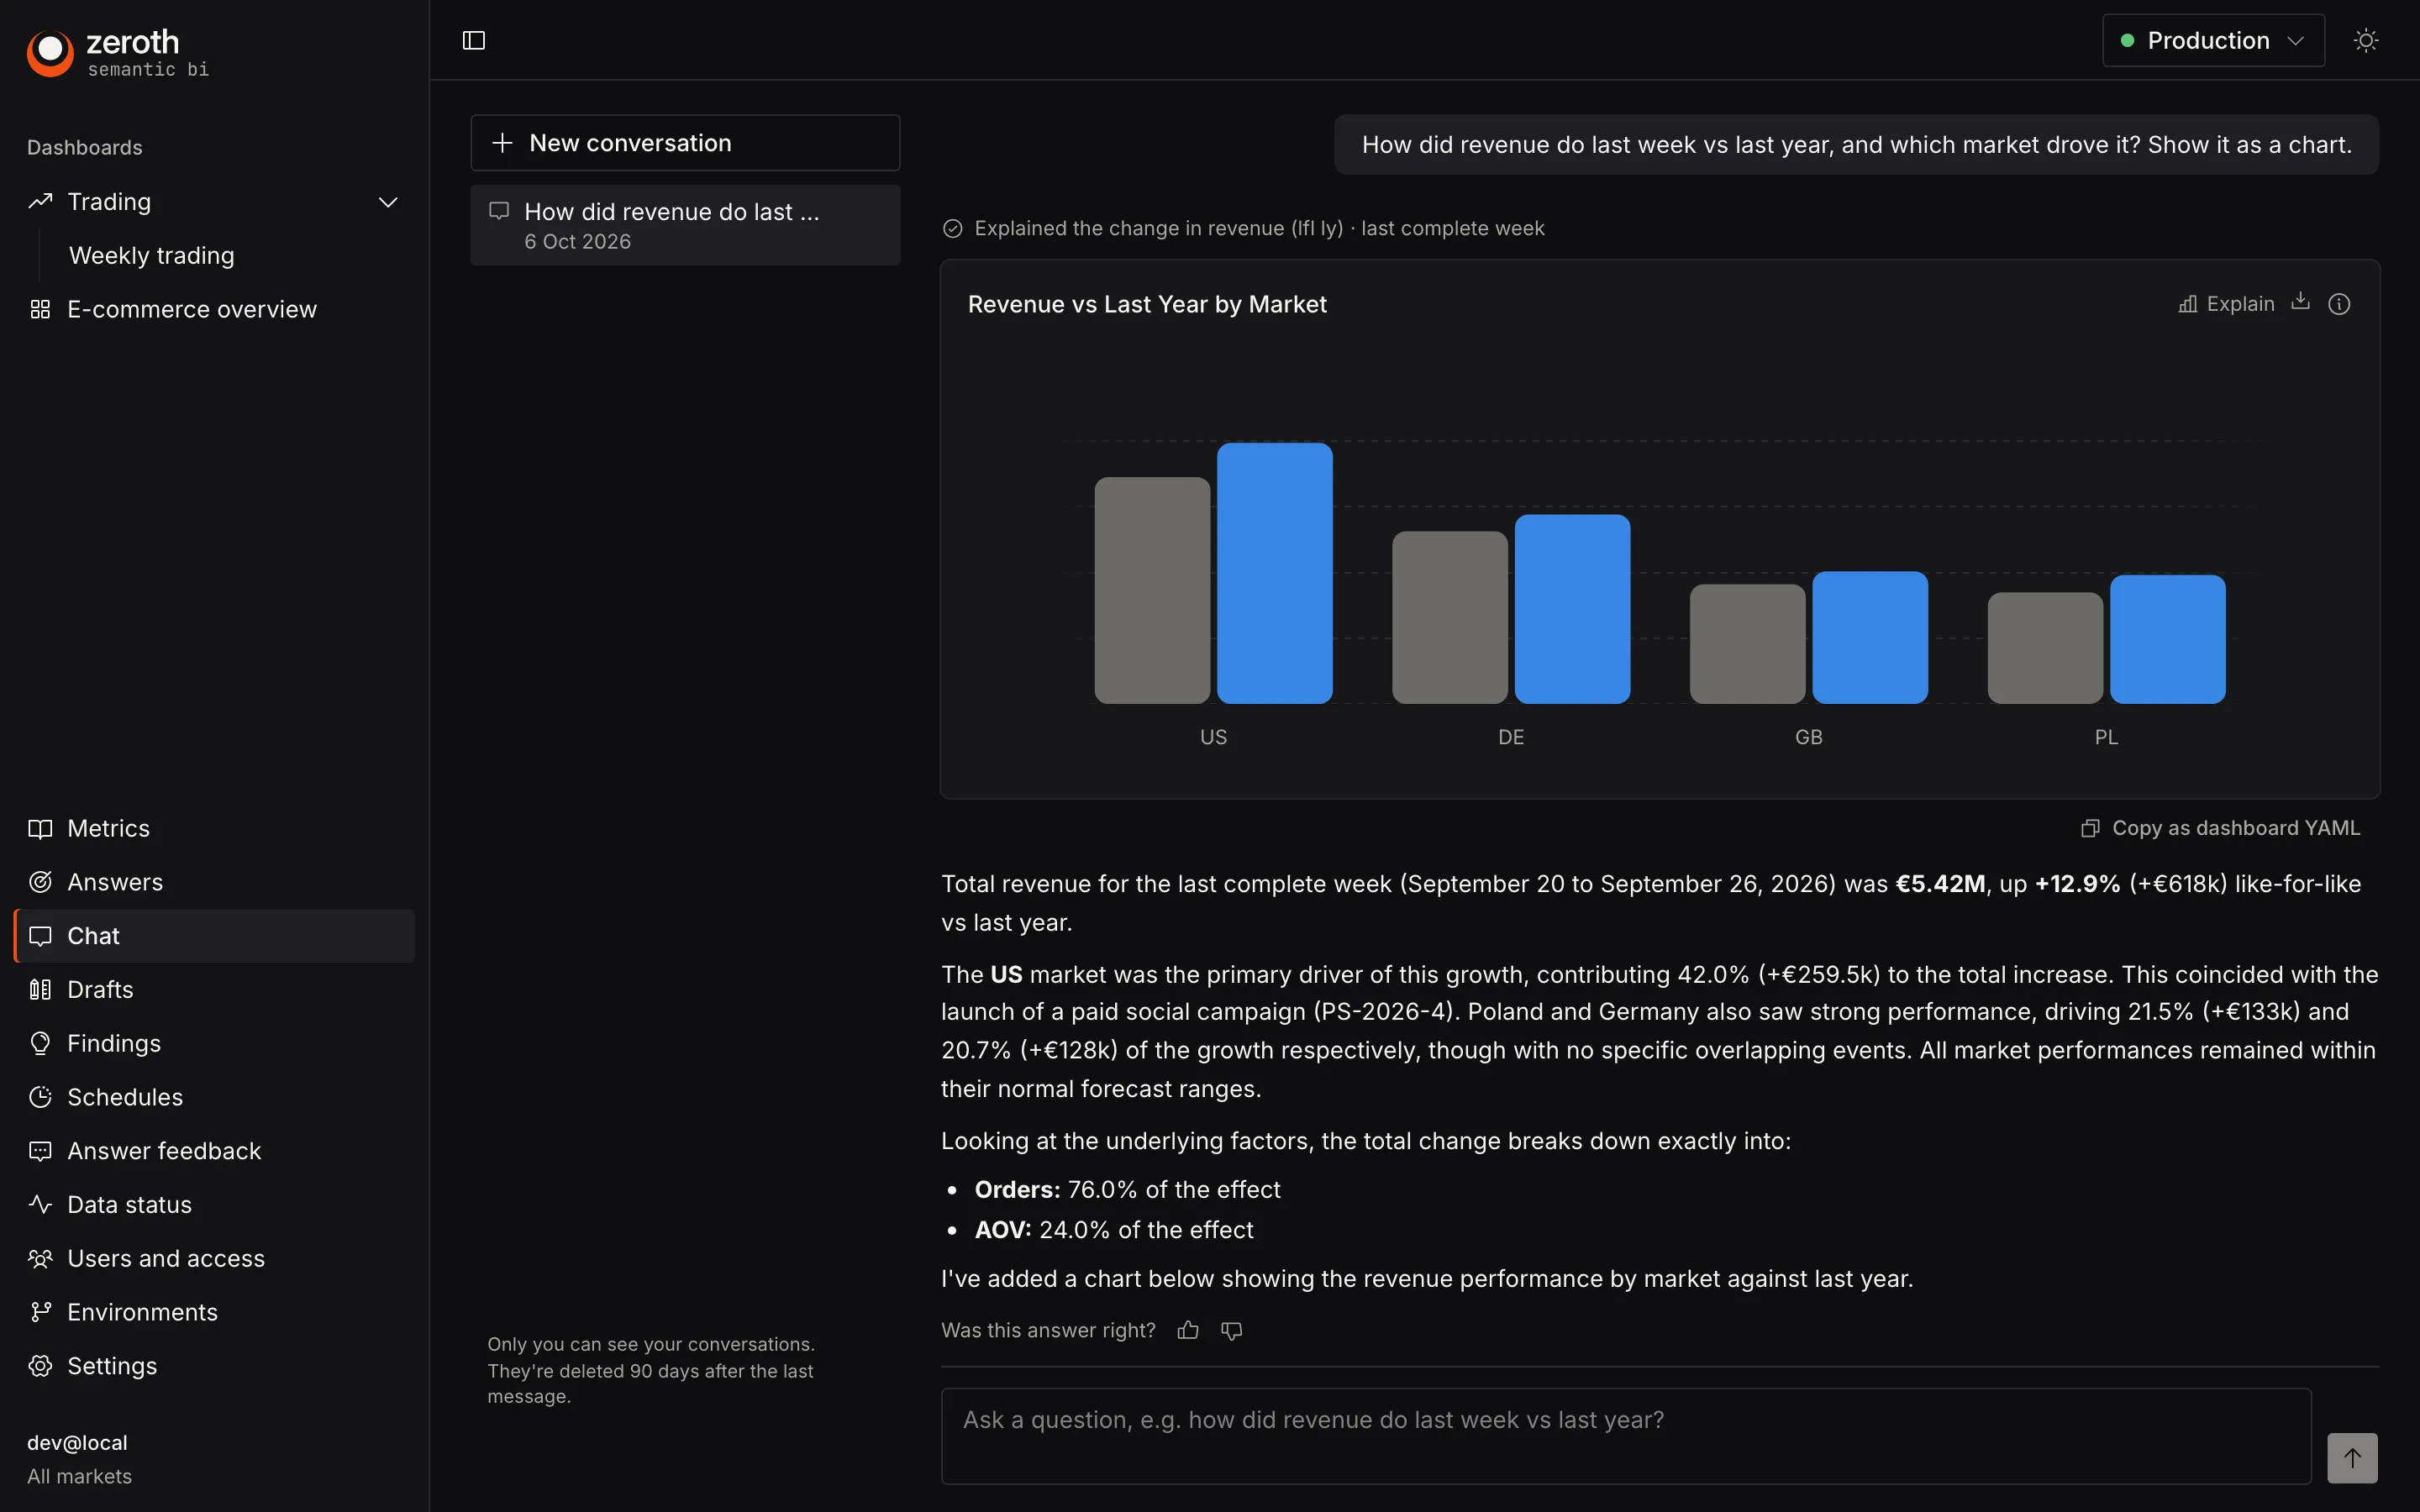
Explain breaks a change into effects that add up exactly, then finds the markets and channels behind it. The chat is read-only and answers only through governed metrics, never raw SQL; generated summaries and findings are checked against the data before anyone sees them.
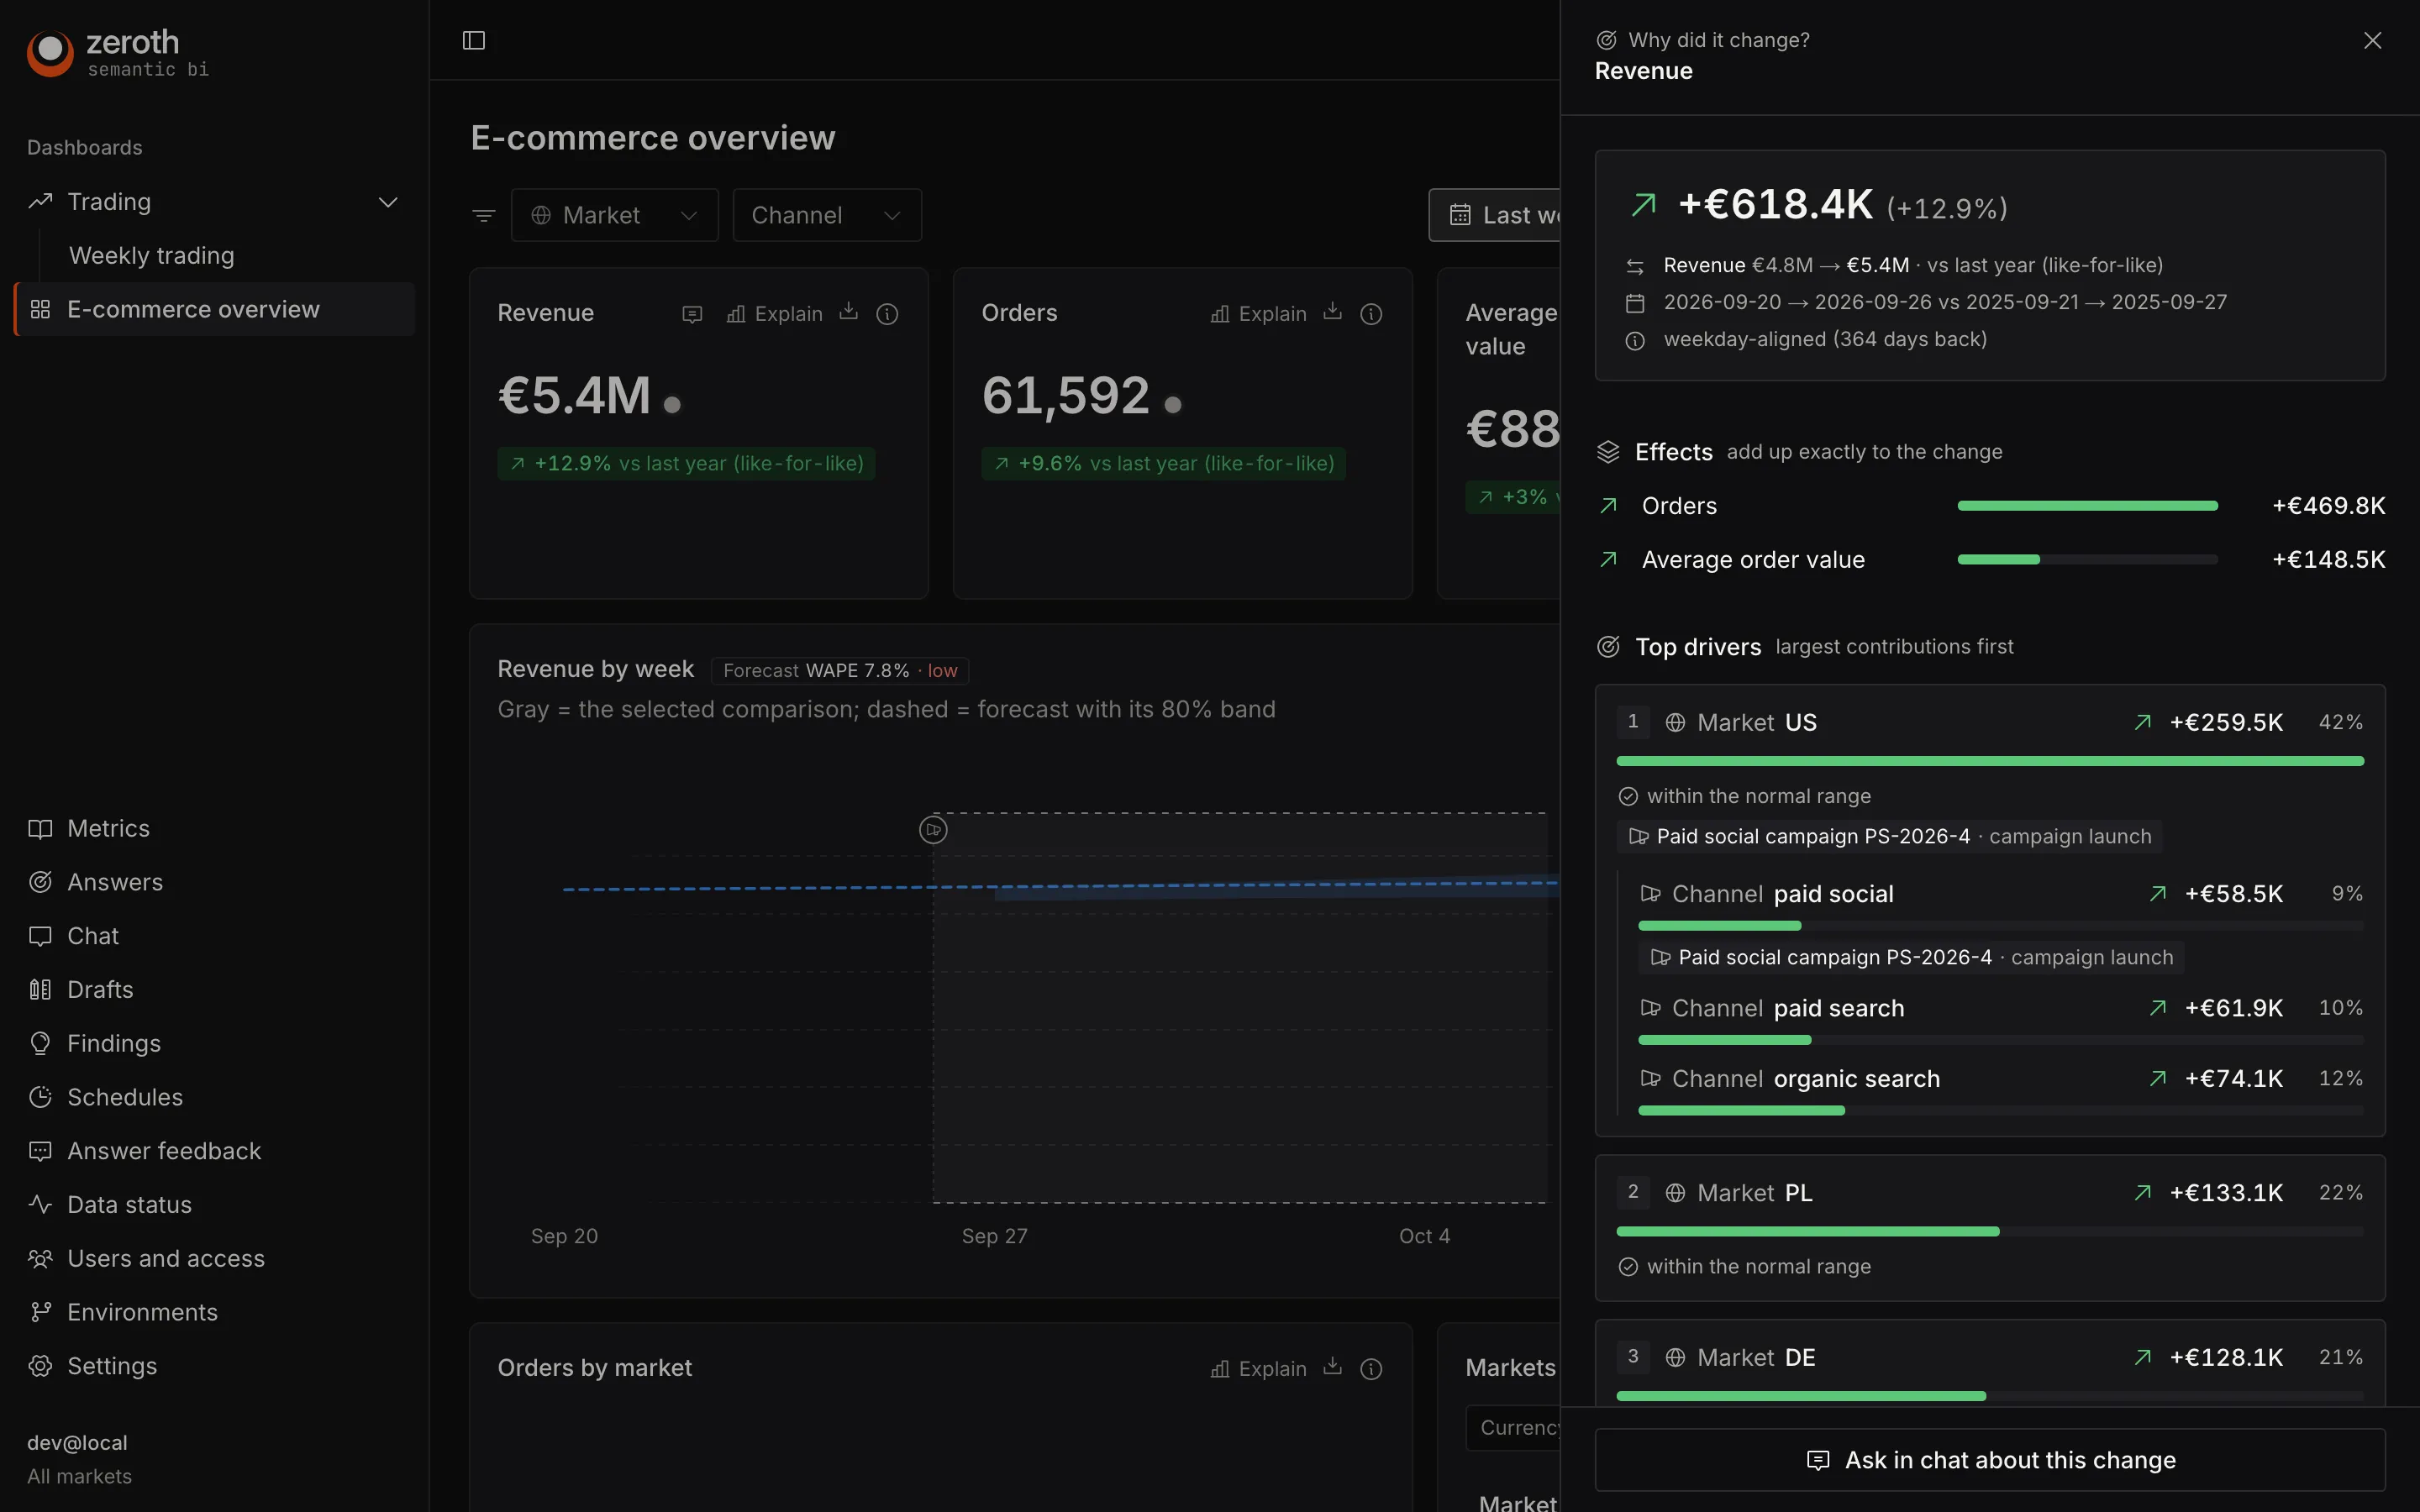
Explain panel for revenue: +€618K (+12.9%) split into orders and average order value effects, with the US, Poland and Germany as top drivers and a paid social campaign as a possible explanation.
Explain · effects add up exactly; events are possible explanations, not causes
A chat answer about last week's revenue vs last year with a bar chart by market and a short written explanation.
Chat · answered by Gemini on Vertex AI through governed metrics only

Built in

The parts every commerce team rebuilds, done once and done right.

Comparisons and calendars

Like-for-like, same period last year, retail 4-4-5 calendars with week 53, constant currency and per-market completeness, in one engine.

Forecasts and targets

Batch forecasts that are kept only if they beat a seasonal-naive baseline, with intervals, projections and phased targets.

A data trust gate

No data version reaches users unless reconciliation checks pass. Stale or incomplete data is flagged, never hidden.

Row-level access

Roles, markets and other scopes apply to every number: dashboards, chat, forecasts and digests alike.

Starter packs

GA4 e-commerce, Shopify commerce and paid media: a model, dashboards and checks to start from on day one.

Environments and previews

Staging and production from branches, and a preview of every pull request before it ships.

All features

Your cloud

Installed in your Google Cloud project. Your data stays there.

One Terraform module, serverless services, nothing always-on except the query engine. The infrastructure installs in about half a day; a full install with a starter pack and first dashboards takes about a day.

  • Semantic layer · Cube Core on DuckDB, fed by daily BigQuery extracts
  • Runs on · Cloud Run, Cloud Run Jobs, Workflows, Scheduler, Cloud Storage
  • Sign-in · Identity-Aware Proxy with your Google accounts and groups
  • AI · Your choice of model; Gemini on Vertex AI recommended, no API keys
  • Idle cost · About one warm Cloud Run instance

Verticals

For e-commerce, omnichannel retail and marketing teams

What Zeroth does for each, with the starter pack to begin from.

Verticals

Compare

How Zeroth differs from Looker, Power BI, Holistics, Lightdash and Metabase

Where each runs, what lives in git, and what's built in.

Compare

See your own numbers in Zeroth.

A walkthrough on a realistic multi-market dataset, then we talk about your stack and what an install would look like.